The $500 Billion Circle: Inside the AI Bubble Where Everyone's Trading Money With Each Other
AI stocks account for 75% of S&P 500 returns, yet many companies are just trading money with each other. Oracle loses $100M quarterly on its $300B OpenAI deal but gained $330B in market cap from the announcement. We've seen this before—the NASDAQ fell 78% after the dot-com bubble.
When a Chart Goes Viral for All the Wrong Reasons
When a Chart Goes Viral for All the Wrong Reasons
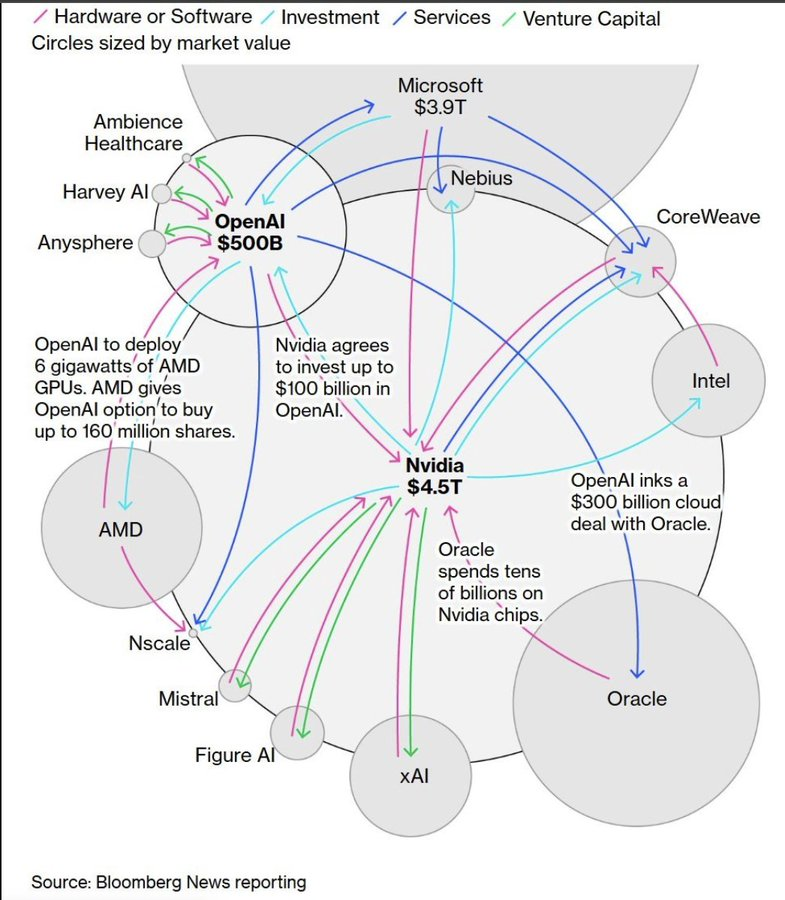
A Bloomberg chart recently went viral on Twitter, and it should terrify anyone with money in tech stocks. The image maps out what analysts are calling "the AI bubble"—a massive web of interconnected investments where the world's most valuable companies are essentially trading money in circles.
At the center sits OpenAI with a $500 billion valuation. Nvidia, worth $4.5 trillion, anchors the other hub. Between them flows a dizzying network of billion-dollar deals: Nvidia investing up to $100 billion in OpenAI, which then commits $300 billion to Oracle for cloud infrastructure, which spends tens of billions buying Nvidia chips, which uses those revenues to justify more AI investments.
The money just circles through the ecosystem, inflating valuations with each pass.
Here's the uncomfortable question nobody wants to ask: What happens when the music stops and we realize these companies are primarily making money by selling to each other, not to actual end users with real revenue?
Welcome to the anatomy of a bubble that makes the dot-com crash look like amateur hour.
The Circular Money Machine: How It Actually Works
Let's break down the mechanics of this financial merry-go-round, because once you see it, you can't unsee it.
The Public Market Web
Nvidia ($4.5T market cap) has committed up to $100 billion to invest in OpenAI. Meanwhile, Nvidia holds significant equity stakes in CoreWeave (an AI cloud computing company), and CoreWeave counts Microsoft—which also owns ~49% of OpenAI's economic rights—as a major customer. Microsoft accounted for almost 20% of Nvidia's revenue on an annualized basis as of Nvidia's 2025 fiscal fourth quarter.[1]
Oracle presents perhaps the most striking example of bubble dynamics. The company signed a $300 billion cloud infrastructure deal with OpenAI over five years—averaging $60 billion annually. This single announcement caused Oracle shares to soar over 40% in one day, adding nearly $330 billion to the company's market value.[1]
But here's the problem: CNBC reporting reveals Oracle is already "losing considerable sums of money" on its data center rentals to OpenAI, including a $100 million loss in the most recent quarter alone.[1] Think about that—Oracle's most valuable AI customer is unprofitable for Oracle itself. The deal announcement created hundreds of billions in shareholder value, but the actual business relationship loses money.
Oracle is simultaneously spending "tens of billions" on Nvidia chips to build the infrastructure for OpenAI, which got its funding partly from Nvidia's investment. So Nvidia invests in OpenAI → OpenAI pays Oracle → Oracle pays Nvidia → Nvidia's revenue justifies investing more in OpenAI. The circle is complete, and nobody's making money except through market cap appreciation based on future promises.
AMD gets an option to purchase 180 million OpenAI shares while deploying 6 gigawatts of GPUs for OpenAI's infrastructure. OpenAI essentially gets computing power now in exchange for equity later—when AMD needs that computing power, who will provide it? Other members of this same ecosystem.
Oracle's position is particularly fascinating. Larry Ellison's company committed to a $300 billion deal with OpenAI, yet Oracle's actual infrastructure costs exceed what they're charging. They're losing $100 million per quarter on the deal but gained $330 billion in market cap from the announcement. Oracle spent tens of billions buying Nvidia chips to fulfill OpenAI's needs, feeding money right back into Nvidia, which invested in OpenAI, which pays Oracle. It's a perfect closed loop where everyone makes money on paper but several participants lose money on operations.
As Chamath Palihapitiya from the All-In podcast might observe: "This is the most elegant Ponzi scheme I've ever seen, except everyone's in on it and they're all betting the same way. The problem with circular dependencies is they all collapse at once."
The Private Market Parallel Universe
Now here's where it gets really interesting: the private markets are running an almost identical playbook, just with less transparency and higher valuations.
OpenAI leads the pack at a $500 billion valuation—almost doubling from $300 billion in less than a year—despite projected 2025 revenues of only $13 billion and losing billions annually.[1] Who's funding this? Microsoft (major investor), Nvidia (up to $100 billion commitment), and a roster of investors who are simultaneously OpenAI's customers, partners, and suppliers.
Anthropic sits at $183 billion valuation with over $5 billion in annual revenue run-rate.[24] Sounds impressive until you realize their major backers are Amazon and Google—the same hyperscalers buying Nvidia chips to power Anthropic's infrastructure, while Anthropic competes against OpenAI, which is backed by Microsoft and Nvidia, who also back...you see the pattern.
xAI (Elon Musk's venture) carries a $200 billion valuation and just raised $10 billion.[25] It merged with X (formerly Twitter) in an all-stock deal. Unlike other players, xAI has a captive distribution channel through X's user base, but it still depends on the same Nvidia chips, the same cloud infrastructure, and the same venture capital ecosystem.
Perplexity AI at $20 billion valuation shows just how frothy this market has become.[26] With approximately $100 million in annual revenue, that's a 200x revenue multiple. Their backers? Nvidia and Jeff Bezos, among others—the same players already invested throughout this ecosystem.
Scale AI presents perhaps the clearest example of circular dependency.[27] Valued at $29 billion, with Meta now owning 49% of the company as of June 2025, Scale AI provides data labeling and preparation services to OpenAI, Meta, and Microsoft. The founder joined Meta as part of the deal. So Meta essentially bought its own supplier, which services Meta's competitors, who buy from the same chip makers that invest in Meta's AI initiatives.
Databricks ($100 billion valuation)[28] and Mistral AI ($14 billion valuation) round out the major private players, both deeply integrated into the same circular investment patterns.
Jason Calacanis from All-In would probably say: "When your customer is also your investor, who's also your supplier's customer, who's also invested in your competitor—you're not building a business, you're building a house of cards."
The Numbers That Should Keep You Up at Night
Let's talk about what these valuations actually mean and why they matter for both public and private market investors.
The Scale of Disconnection from Reality
AI-related capital expenditures surpassed the U.S. consumer as the primary driver of economic growth in the first half of 2025, accounting for 1.1% of GDP growth.[1] JP Morgan Asset Management notes that AI-related stocks have accounted for 75% of S&P 500 returns, 80% of earnings growth, and 90% of capital spending growth since ChatGPT launched in November 2022.[1]
Let that sink in: three-quarters of your stock market gains are coming from a sector where companies are primarily trading money with each other.
RBC's Kelly Bogdanova points out that "the gap between the Tech sector's share of market cap and net income has widened significantly" since late 2022.[1] Translation: tech companies represent a bigger share of market value than their actual earnings justify.
Nearly two-thirds of venture capital deal value in the U.S. went to AI and Machine Learning startups in the first half of 2025, up from 23% in 2023.[1] That's not diversification—that's concentration risk on steroids.
Private Market Valuations: The New Insanity
Consider these revenue multiples:
- OpenAI: $500B valuation ÷ $13B revenue = 38x revenue (while losing billions annually)[1]
- Anthropic: $183B valuation ÷ $5B revenue = 36x revenue[24]
- xAI: $200B valuation ÷ minimal revenue = effectively infinite multiple[25]
- Perplexity AI: $20B valuation ÷ $100M revenue = 200x revenue[26]
- Hugging Face: $4.5B valuation on modest revenue = 150x revenue multiple
For context, Amazon—an actual profitable company—trades at roughly 3-4x revenue. Microsoft trades around 13x revenue. These AI private companies are valued at 10-50x what comparable public companies command, based purely on growth promises.
As David Sacks from All-In might note: "When you're paying 200x revenue for a company that's not profitable, you're not investing—you're speculating that someone else will pay 300x revenue next year. That's not a valuation method, it's musical chairs."
The Infrastructure Reality Check Nobody's Talking About
Here's where the bubble meets physical reality—and why even if AI lives up to the hype, many of these valuations won't survive.
The Power Problem: Simple Math, Impossible Scale
Every one of these AI companies, public and private, faces the same existential challenge: they can't actually deploy the infrastructure their business models require.
The numbers are staggering:
- U.S. data center energy consumption: 176 TWh in 2023 (4.4% of total U.S. electricity)[2]
- Projected 2030 consumption: 945 TWh globally—more than doubling in seven years[3]
- This equals Japan's entire electricity demand[4]
OpenAI's Stargate initiative alone plans 10 data centers requiring 5 gigawatts each—that's more power than the entire state of New Hampshire uses.[5] Where's that power coming from?
Venture capitalist Chamath Palihapitiya warns: "If we don't find some compelling solves, electricity rates will double in the next five years."[6] And he's right—wholesale electricity prices in areas near data centers have already surged up to 267% compared to five years ago.[7]
The Time-to-Power Bottleneck
Even with billions in capital, companies like Meta cannot fully deploy it due to shortages in transformers, power equipment, and cooling systems. Suppliers like Schneider Electric are booked until 2030.[8]
Goldman Sachs Research estimates that about $720 billion in grid spending through 2030 will be needed just to keep up with data center demand.[9] Electric and gas utility capital expenditures are forecasted to jump 22% year-over-year to $212 billion in 2025.[10]
Here's the problem: timelines for investing in and building out grids for regulated utilities have become longer than the development cycle of data centers.[8] Time-to-power is the biggest consideration for data center operators, yet infrastructure availability is measured in years, not months.
As David Friedberg from All-In would point out: "When your ten-year infrastructure build timeline meets your 18-month cash runway, physics beats capital every time."
The Nuclear Hail Mary
Facing this crisis, tech giants are making unprecedented bets on nuclear power:
- Microsoft: $1.6 billion to restart Three Mile Island Unit 1 by 2027, providing 835 MW exclusively for Microsoft data centers over 20 years[11]
- Amazon: $1 billion commitment including a 1.9-gigawatt power purchase from Talen Energy's Susquehanna plant[12]
- Google: Partnership with Kairos Power to deploy small modular reactors, with first site by 2030[13]
- Meta: Commitment to source 1-4 gigawatts of new nuclear capacity (though bee habitat issues recently scuttled one proposed site)[11]
The problem? Even the most bullish developers acknowledge this is a 10-year solution for a 24-month, three-to-five-year problem.[14] These companies need power now to justify their valuations. Nuclear power won't arrive until the 2030s—if it arrives at all.
Nuclear energy stocks have surged 40% year-to-date through 2025, but construction costs for new nuclear facilities range from $15-28 billion per gigawatt.[12] NuScale's cancelled Idaho SMR facility saw costs balloon from $3.6 billion to $9.3 billion before termination.[12]
Déjà Vu: The Dot-Com Playbook Playing Out Again
If this all feels familiar, there's a reason. We've seen this movie before, and we know how it ends.
The Dot-Com Parallel Nobody Wants to Acknowledge
Between 1995 and March 2000, investments in the NASDAQ composite rose 600%, only to fall 78% by October 2002, wiping out more than $5 trillion in market value.[15]
The mechanics were identical to today:
Circular Investment Patterns: After the Telecommunications Act of 1996, telecom companies invested over $500 billion into laying fiber optic cable, adding switches, and building networks.[15] Companies essentially paid each other with investor money, creating the illusion of sustainable business models.
Massive Infrastructure Spending: Telecom companies raised $1.6 trillion on Wall Street and floated $600 billion in bonds, creating 80.2 million miles of fiber optic cable—representing 76% of total U.S. digital wiring at that point.[16] Sound familiar? Today, utilities are forecasting over $1 trillion in cumulative capex over the next five years just for AI-related power infrastructure.[10]
Revenue-Free Valuations: Most companies that went public during the dot-com era were highly overvalued, with prices continuing to rise despite little or no profitability.[17] Today's AI private companies make those look conservative—200x revenue multiples would have been considered insane even at the peak of the dot-com bubble.
Insider Cashing Out: Between September 1999 and July 2000, insiders at dot-com companies cashed out $43 billion, twice the rate of 1997-1998.[16] By the time regular investors realized what was happening, the smart money had already left.
The Burst Pattern: Three Ways This Ends
Drawing from dot-com history and current AI dynamics, here are the most likely scenarios:
Scenario 1: The Revenue Reality Check
OpenAI projects $13 billion in 2025 revenue but is losing billions annually while committing to $60 billion in annual infrastructure spending with Oracle.[1] The math doesn't work. When investors realize that revenues can't support infrastructure costs, valuations collapse.
Even more concerning: Oracle itself is losing money fulfilling OpenAI's $300 billion deal. If the infrastructure provider can't profit from the AI company, and the AI company can't profit from end users, where do profits come from? Answer: they don't. The business model is broken at multiple levels.
In the dot-com era, Pets.com's market cap plummeted from over $300 million to zero in less than a year.[18] Today, we have dozens of private AI companies with comparable burn rates and worse unit economics—plus public infrastructure companies like Oracle admitting losses on their biggest AI deals.
As Alan Patricof, a venture capital legend, reflected at a recent CEO Summit: "There will be winners and losers, and the losses will be pretty significant."[1]
Scenario 2: The Infrastructure Bottleneck Cascade
When you can't build what you've sold, valuations become fictional. Even with infinite capital, physical constraints mean projects get delayed, costs escalate, and early movers can't achieve competitive advantages because everyone is infrastructure-constrained.
Oracle's situation epitomizes this risk. Despite committing to a $300 billion deal with OpenAI, they're already losing $100 million per quarter because infrastructure costs exceed revenue.[1] They can't scale profitably even with the world's most valuable AI customer. If Oracle—with decades of data center experience and massive resources—can't make the economics work, what does that say about smaller players?
The CNBC reporting that Oracle is "losing considerable sums of money" on data center rentals to OpenAI is the canary in the coal mine. When the most valuable AI customer is unprofitable for its infrastructure provider, and that provider is unprofitable for its chip supplier, how does anyone in this chain actually make money?
Scenario 3: The Credit Market Trigger
Just like in early 2000, when the Federal Reserve raised interest rates and funding dried up, an external shock to capital availability could trigger the cascade.[19]
Many of these private companies require continuous capital infusions to survive. OpenAI, despite its $500 billion valuation, needs funding rounds every 12-18 months just to cover losses. If venture capital or corporate investment slows—due to rising rates, recession fears, or simply return requirements—the house of cards collapses.
When a small group of interconnected companies is securing most major deals and the same names appear as investors, customers, and partners across dozens of transactions, you don't have a diversified ecosystem—you have a circular dependency waiting to unravel.
Winners and Losers: Who Survives the Bubble Burst?
History provides a brutal but clear roadmap for what happens next.
The Survivors' Playbook
In the dot-com crash, approximately 7,000-10,000 online enterprises launched in the late 1990s. By mid-2003, about 4,800 had either been sold or gone under.[16] But some survived and thrived.
Amazon saw its share price crash from around $100 to just $7 after the bubble burst—a 93% decline—before rebounding spectacularly.[18] What saved Amazon? Real revenue from actual customers buying physical products, not from other bubble participants.
eBay, Salesforce, and Priceline similarly survived by having genuine revenue streams from end users, not from circular investment patterns.[15]
In today's AI ecosystem, the survivors will share these characteristics:
Real End-User Revenue: Companies generating income from customers outside the bubble ecosystem. Think businesses using AI to sell products/services to consumers or traditional enterprises, not other AI companies.
Diversified Business Models: Microsoft will survive an AI crash because it has Office, Azure, Xbox, and LinkedIn. Pure-play AI startups with single-product lines are the most vulnerable.
Infrastructure Ownership: Companies that own critical infrastructure (data centers, power plants, semiconductor fabs) rather than just renting access will have tangible assets worth something even in a crash.
Positive Unit Economics: Businesses that actually make money on each customer, not ones that lose money at scale hoping for "eventual" profitability.
The Casualties List: Who Gets Crushed
Drawing from dot-com patterns and current dynamics, here are the profiles of companies most at risk:
Pre-Revenue Valuations: Any company valued over $1 billion without at least $100 million in revenue from end customers is effectively speculating on future adoption that may never arrive. Perplexity AI at $20 billion on $100 million revenue is 200x revenue—that multiple can't survive a market correction.[26]
Circular Revenue Dependencies: Companies where >50% of revenue comes from other bubble participants are doomed. If Scale AI's revenue primarily comes from OpenAI, Meta, and Microsoft (all interconnected investors and customers), what happens when any one of them cuts spending?[27]
Infrastructure-Dependent Models: Businesses whose entire value proposition assumes infrastructure availability that doesn't exist. When power constraints, chip shortages, or data center capacity limit actual deployment, theoretical models become worthless.
Burn-Rate Champions: Companies spending billions while hoping for eventual profitability. xAI, despite its $200 billion valuation and Elon Musk's involvement, has minimal revenue against substantial costs.[25] How many funding rounds until investors demand returns?
As David Siegel, computer scientist and Two Sigma co-founder, candidly advised at a recent summit: "[AI technologies are] transforming business," but he implies the transformation won't save every player.[1]
The Broader Market Impact: Why This Matters Even If You Own Zero AI Stocks
Don't assume this stays contained. AI-related stocks have accounted for 75% of S&P 500 returns since ChatGPT launched.[1] When that reverses, it doesn't just hurt tech investors—it hurts every 401(k), pension fund, and index fund.
The dot-com burst led to a bear market lasting around two years affecting the entire stock market, not just technology.[20] The NASDAQ fell 75% between March 2000 and October 2002.[15] Given AI's even larger share of market returns today, an AI bubble burst would likely trigger a broader and deeper market collapse.
Goldman Sachs' research showing that eight hyperscalers expect a 44% year-over-year increase to $371 billion in 2025 capex for AI infrastructure means that when spending slows, it doesn't taper—it crashes.[9] Companies either keep building or admit the model doesn't work. There's no middle ground.
Investment Strategies: Understanding Different Approaches to AI Exposure
For investors and financial professionals analyzing AI investments, the question isn't whether to avoid AI entirely—it's how to position portfolios to capture legitimate innovation while avoiding the bubble's worst casualties.
The Public Market Approach
1. The "Picks and Shovels" Strategy
This approach focuses on infrastructure providers with revenue streams independent of AI's success:
Power and Utilities: Electric and gas utilities with $1 trillion in forecasted cumulative capex over 2025-2029 offer regulatory protection and guaranteed returns regardless of AI outcomes.[10] Companies like NextEra Energy, Duke Energy, and Southern Company benefit from data center demand without depending on AI profitability.
Semiconductor Equipment Makers: ASML (which makes the machines that make the chips) and Applied Materials benefit from AI chip demand but serve broader semiconductor markets. They're one step removed from AI-specific risk.
Energy Infrastructure: Companies building transmission lines, transformers, and distribution systems (like Quanta Services, MYR Group) have multi-year backlogs regardless of AI hype cycles.
2. Defensive AI Positioning
This strategy targets companies with:
- Diversified revenue streams: Microsoft, Alphabet, Amazon have profitable core businesses beyond AI
- Positive cash flow: Current profitability, not promises of future earnings
- Reasonable valuations: P/E ratios below 40, price-to-sales below 15x
- Operational AI usage: Companies using AI to reduce costs or improve existing products, not pivoting entire business models to AI
3. Position Sizing Considerations
During the 1999-2000 dot-com rate hike cycle, an all-stock portfolio gained 11.04% while a 60/40 portfolio rose 7.64%. When the bubble burst, bonds surged 15.13% while stocks declined 4.28%.[21]
Common allocation approaches include:
- AI-exposed stocks: Limited to 15-20% of equity allocation
- Pure-play AI companies: No more than 5% of total portfolio
- Geographic diversification: Balance U.S. tech concentration with international exposure
- Sector diversification: Maintain positions in energy, materials, healthcare, and consumer staples
The Private Market Considerations: Understanding the Risks
For accredited investors considering private AI exposure, it's important to understand both the access methods and unique risks involved.
Access Methods:
1. Secondary Markets (Accredited Investors Only)
- Platforms like Hiive, Forge, and EquityZen allow buying shares from employees
- Requirements: $200K+ annual income or $1M+ net worth (excluding primary residence)
- Typical minimums: $10K-$100K depending on company
- Key concerns:
- Liquidity: Difficult to sell when needed
- Valuation: Often paying peak bubble prices with limited price discovery
- Information asymmetry: Employees typically know more about company health than buyers
2. Venture Capital Funds
- Funds like ARK Venture Fund hold OpenAI, xAI, Anthropic, and Perplexity[24][25][26]
- Open to all investors but typically charge 2.90%+ annual fees
- Very indirect exposure (holdings may represent <2% of fund)
- Key concerns:
- High fees reduce returns even in best-case scenarios
- No control over which companies fund selects
- Fund performance tied to overall VC market, not specific companies
3. SPACs and Future IPOs
- CoreWeave went public in March 2025 as first pure-play AI infrastructure IPO
- New SPACs continue to target AI, energy, crypto/DeFi, and defense sectors
- Key concerns:
- Some SPAC sponsors have warned retail investors about risks
- SPACs have historically delivered poor post-merger returns
- Yale Journal on Regulation: "SPACs have delivered poor post-merger returns to shareholders for many years"
- Goldman Sachs banned itself from underwriting SPACs for three years
Understanding Private Market Reality:
Most private AI companies exist inside the circular money flow. For true diversification away from the bubble, investments would need to focus on companies generating real revenue from end customers, not trading money with other bubble participants.
Potentially Better-Positioned Private Investments:
- Scale AI and Databricks serve broader markets beyond the OpenAI ecosystem
- Hugging Face provides infrastructure used across the entire open-source AI community
- Even these face concentration risk—Scale AI is now 49% owned by Meta
Higher Risk Private Investments:
- Any private AI company with revenue primarily from other AI companies
- Valuations >100x revenue without clear path to profitability
- Companies dependent on infrastructure that doesn't exist yet
- Late-stage funding rounds where insiders are selling
Advanced Risk Analysis Frameworks
Beyond basic allocation strategies, sophisticated analysis of AI investments requires understanding deeper structural risks:
Infrastructure Due Diligence: Evaluating whether a company's growth plan is physically possible given power availability, semiconductor supply, and data center capacity—not just financially viable on paper. This involves analyzing time-to-power constraints, utility capacity planning, and regional grid limitations.
Circular Dependency Mapping: Tracking investment flows to identify which companies are actually selling to end users versus which are trading money with each other. If Company A's revenue comes from Company B, which is funded by Company C, which depends on Company A's success—that represents systemic risk, not a healthy ecosystem.
When analyzing the Nvidia → OpenAI → Oracle → Nvidia circular flow, critical questions include: "Where does real profit come from?" If Oracle loses $100M/quarter serving OpenAI, and OpenAI loses billions annually, and both depend on market cap appreciation rather than operational profits, the entire structure is built on speculation, not fundamentals.
Portfolio Stress Testing: Creating scenario analyses for different bubble-burst catalysts:
- Revenue growth scenarios: What happens if AI revenue grows 20% annually instead of 100%?
- Infrastructure constraint scenarios: What if power limitations restrict data center growth by 50%?
- Interest rate scenarios: How do valuations change with 6% vs 8% cost of capital?
- Competition scenarios: What if open-source models reduce pricing power?
Regulatory Risk Assessment: Understanding how utility rate structures, power purchase agreements, and grid interconnection rules affect company valuations. The Federal Energy Regulatory Commission's rejection of Amazon's attempt to expand power sales from 300 MW to 480 MW at the Susquehanna plant demonstrates regulatory risk is real and often underpriced in valuations.[11]
Liquidity Mismatch Analysis: Private AI holdings create enormous liquidity risk. When holding shares in a $100 billion private company, selling during warning signs becomes impossible—investors remain locked in until an exit event that may never come or arrives at a much lower valuation.
Exit Strategy Development: In bubble markets, entry price matters less than exit timing. Systematic approaches to reduce exposure often rely on rules-based indicators:
- Revenue growth decelerating while capex accelerates
- Major insiders selling personal holdings on secondary markets
- Credit spreads widening on corporate debt
- Venture funding rounds lengthening or requiring down-rounds
- Infrastructure providers reporting losses on AI deals (like Oracle)
Warning Signs: How to Know When the Bubble Is About to Pop
Based on dot-com history and current dynamics, watch for these indicators:
Early Warning Signals
- Revenue growth slowing while valuations stay elevated or rise
- Major funding rounds taking longer to close or requiring down-rounds
- Insiders selling personal holdings on secondary markets
- Infrastructure providers losing money on AI deals (like Oracle's $100M quarterly losses on OpenAI)[1]
- Infrastructure delays becoming public (power shortages, chip constraints)
- Credit market tightening with corporate borrowing costs rising
Intermediate Warnings
- High-profile failures of AI startups despite recent funding
- Major customers reducing spending on AI infrastructure
- Regulatory scrutiny increasing around power allocation, market concentration
- Media sentiment shifting from cheerleading to skepticism
- "AI for AI's sake" projects being cancelled at enterprises
Terminal Signals
- Major player bankruptcy or near-bankruptcy requiring rescue
- Widespread hiring freezes or layoffs at AI companies
- IPO market closing with failed offerings or dramatic first-day losses
- Venture capital firms stopping new AI investments
- Credit events with major defaults or restructurings
As of October 2025, we're seeing early warning signals but not yet intermediate warnings. The window for repositioning is open but narrowing.
The Unexpected Winners: Where Smart Money Is Positioning Now
Beyond the obvious "picks and shovels" plays, sophisticated investors are identifying second-order opportunities:
Data Center Real Estate in Tier-2 Cities: As costs soar in Northern Virginia's "Data Center Alley" and Silicon Valley, secondary markets with available power become premium locations.[22] Cities near nuclear plants, hydroelectric facilities, or with favorable regulatory environments offer value.
Cooling Technology: Around 35-40% of a hyperscaler's energy consumption is from cooling.[9] Companies solving this challenge—whether through liquid cooling, improved HVAC efficiency, or innovative designs—have stable demand regardless of AI's success.
Industrial Real Estate Near Energy Sources: With tech giants signing 20-year nuclear power purchase agreements, proximity to these facilities creates new value.[11] Land near Three Mile Island, Susquehanna plant, or planned SMR sites could appreciate significantly.
Renewable Energy Storage: Scaling energy storage economically requires local providers of lithium iron phosphate cathode active materials. Companies like Redwood Materials (battery recycling), QuantumScape (solid-state batteries), and Form Energy (long-duration storage) benefit from infrastructure spending without AI-specific risk.
Grid Modernization Infrastructure: Smart grid technology, distribution automation, and grid-scale battery storage all benefit from utility spending increases. Companies like Itron, Landis+Gyr, and Stem provide these technologies.
Defense Contractors: AI's military applications drive spending independent of consumer AI adoption. Companies like Palantir, Anduril, and traditional defense contractors integrating AI have government revenue streams largely isolated from bubble dynamics.
The Dot-Com Silver Lining: Why Bubbles Sometimes Create Value
Before painting an entirely apocalyptic picture, remember this: the dot-com crash, devastating as it was for investors, created the foundation for today's internet economy.
The resulting glut of fiber optic cable meant severe overcapacity in bandwidth that allowed the next wave of companies to deliver sophisticated services cheaply. By 2004, bandwidth costs had fallen over 90% despite usage doubling every few years.[16] As late as 2005, 85% of U.S. broadband capacity went unused[16]—creating room for YouTube, Netflix, cloud computing, and smartphones.
Similarly, today's infrastructure investments—even if driven by bubble dynamics—will create real assets:
- Data centers will exist and need tenants
- Power infrastructure will serve other industries
- AI models and training techniques will improve
- Semiconductor manufacturing capacity will support future technologies
The question isn't whether useful infrastructure gets built—it's whether current investors profit from building it or if the next generation of entrepreneurs buys it at fire-sale prices and captures the value.
Amazon, remember, fell 93% from its peak to $7 per share.[18] Investors who bought at $100 during the bubble lost nearly everything. But investors who bought at $10 after the crash made 2,000%+ returns over the next two decades.
Practical Financial Planning Considerations
Understanding bubble dynamics has practical implications for portfolio management and financial planning across different investor types.
For Investors With Significant Public Tech Exposure
Potential Rebalancing Considerations:
- Evaluating whether tech allocation exceeds 25% of total equity holdings
- Implementing tax-loss harvesting strategies on underperforming positions
- Adding exposure to defensive sectors like utilities, consumer staples, and healthcare
- Considering protective options strategies on concentrated tech holdings
Medium-Term Portfolio Review Points:
- Systematic reduction plans that sell into strength rather than waiting for market stress
- Geographic diversification beyond U.S. tech megacaps
- Cash position adequacy (some advisors suggest 15-25% for opportunistic buying)
- Historical perspective: dot-com investors who held from peak to trough waited 15 years for recovery[23]
For Accredited Investors Evaluating Private AI Exposure
Risk-Reward Analysis:
The asymmetry in private AI investments often tilts unfavorably:
- Potential upside: 2-3x returns if company succeeds and achieves favorable exit
- Downside risk: 100% loss with zero liquidity while waiting years
- Historical probability: Most private AI companies will likely fail or exit at lower valuations than late-stage funding rounds
Alternative Approaches: Some financial strategists suggest waiting for bubble corrections to buy surviving public companies at rational valuations. Amazon at $7 per share (post-crash) dramatically outperformed Amazon at $100 per share (peak bubble) over the following two decades.[18]
For All Investor Types: Building Financial Resilience
Financial Foundation Considerations:
- Emergency reserves: Some planners suggest 12-18 months expenses in cash during market uncertainty
- Debt evaluation: Reviewing variable-rate debt exposure before potential rate changes
- Income diversification: Assessing concentration risk in single employers, especially in tech sector
- Insurance adequacy: Ensuring coverage is appropriate before market stress periods
Positioning for Market Opportunities:
- Capital reserves: Maintaining 20-30% of investment portfolio in cash/short-term bonds for opportunities
- Credit access: Establishing home equity lines or margin availability before market stress
- Research preparation: Identifying quality businesses to consider at lower valuations
- Decision frameworks: Creating conviction lists and investment criteria before emotional market conditions
Common Behavioral Mistakes to Avoid:
- Timing attempts: Systematic reduction typically outperforms all-or-nothing timing attempts
- Complete cash conversion: Missing legitimate opportunities while inflation erodes purchasing power
- Panic liquidation: Diversified portfolios with quality holdings historically recover
- Averaging down in bubbles: This approach increases rather than reduces risk during valuation extremes
The Bottom Line: Acknowledging Reality Before the Market Forces It
Let's be completely clear about what we're facing:
The Good News:
- AI is real, transformative technology that will reshape industries
- Many applications will generate enormous value and profits
- Infrastructure investments will create useful capacity regardless of bubble outcomes
- Some companies will emerge as dominant winners worth trillions
The Bad News:
- Current valuations assume everything goes perfectly for everyone simultaneously
- The circular money flow means all participants are betting on each other's success
- Even infrastructure providers like Oracle are losing money on AI deals despite creating $330B in market cap from deal announcements[1]
- Physical infrastructure constraints make current growth projections impossible
- Most companies are overvalued by 10-50x compared to reasonable metrics
- Private markets are even more overvalued than public markets with zero liquidity
The Reality: This is a bubble. It will burst. The only question is when and what triggers it.
AI-related capital expenditures accounting for 1.1% of GDP growth and 75% of S&P 500 returns from a sector where companies primarily trade money with each other isn't sustainable.[1] It's the definition of a bubble.
As Jason Calacanis from All-In might summarize: "The biggest risk isn't missing the AI revolution. It's confusing a capital allocation mania with sustainable innovation and losing wealth right before the fire sale begins."
Investment discipline—being extraordinarily selective, maintaining cash reserves, and preparing to buy quality assets at reasonable valuations—often proves more valuable than chasing momentum during bubble periods.
Understanding the Path Forward
As investors and financial professionals evaluate AI investments, several key principles emerge from this analysis:
The Core Reality:
- AI represents genuine transformative technology with long-term value creation potential
- Current valuations in both public and private markets appear disconnected from near-term fundamentals
- The circular investment pattern creates systemic risk that extends beyond individual companies
- Physical infrastructure constraints (power, data centers, chips) create bottlenecks regardless of capital availability
Historical Context Matters: The dot-com era demonstrated that transformative technology can coexist with unsustainable valuations. The internet was real and revolutionary—but that didn't prevent 78% market declines and thousands of company failures.[15] Infrastructure investments from that bubble (fiber optic cables) eventually enabled the next wave of innovation, though often with different owners at much lower costs.[16]
Investment Discipline: Financial history suggests that maintaining investment discipline during periods of market exuberance often produces better long-term outcomes than trying to ride bubbles to the peak. This includes:
- Understanding what you own and why
- Evaluating valuations relative to fundamentals, not relative to other bubble participants
- Maintaining diversification across sectors, geographies, and asset classes
- Having systematic approaches rather than emotional reactions
The Information Advantage: Private market participants should recognize the significant information asymmetry. When employees sell shares on secondary markets, they typically know far more about company trajectory, burn rates, and internal challenges than buyers. Late-stage private investments often transfer risk from informed insiders to uninformed outside investors.
Professional Guidance: Given the complexity of evaluating circular investment flows, infrastructure dependencies, private market illiquidity, and bubble dynamics, working with qualified financial professionals becomes particularly valuable during periods of market exuberance. This is when avoiding mistakes matters more than finding winners.
The Bloomberg chart showing circular money flows serves as a useful reminder: when companies are primarily making money by selling to each other rather than end users, eventually someone has to generate actual profits from actual customers. Until that happens, the entire structure remains speculation rather than investment.
For those interested in deeper analysis of specific holdings, portfolio positioning, or risk management approaches, consultation with qualified financial advisors, CPAs, and other appropriate professionals is strongly recommended.
Sources
[1] Yale Insights. (2025). "This Is How the AI Bubble Bursts." https://insights.som.yale.edu/insights/this-is-how-the-ai-bubble-bursts
[2] Dev/Sustainability. (2025). "Data center energy and AI in 2025." https://www.devsustainability.com/p/data-center-energy-and-ai-in-2025
[3] International Energy Agency. (2025). "Energy demand from AI." https://www.iea.org/reports/energy-and-ai/energy-demand-from-ai
[4] Carbon Brief. (2025). "AI: Five charts that put data-centre energy use – and emissions – into context." https://www.carbonbrief.org/ai-five-charts-that-put-data-centre-energy-use-and-emissions-into-context/
[5] MIT Technology Review. (2025). "We did the math on AI's energy footprint." https://www.technologyreview.com/2025/05/20/1116327/ai-energy-usage-climate-footprint-big-tech/
[6] Benzinga. (2025). "Chamath Palihapitiya Warns AI Push By GOOGL, META, MSFT And AMZN Using NVDA Chips Could Double Electricity Rates." https://www.benzinga.com/markets/equities/25/10/48036166/chamath-palihapitiya-warns-ai-push-by-googl-meta-msft-and-amzn-using-nvda-chips-could-double-electricity-rates
[7] Bloomberg. (2025). "How AI Data Centers Are Sending Your Power Bill Soaring." https://www.bloomberg.com/graphics/2025-ai-data-centers-electricity-prices/
[8] McKinsey. (2024). "How data centers and the energy sector can sate AI's hunger for power." https://www.mckinsey.com/industries/private-capital/our-insights/how-data-centers-and-the-energy-sector-can-sate-ais-hunger-for-power
[9] Goldman Sachs. (2025). "AI to drive 165% increase in data center power demand by 2030." https://www.goldmansachs.com/insights/articles/ai-to-drive-165-increase-in-data-center-power-demand-by-2030
[10] Deloitte. (2025). "Can US infrastructure keep up with the AI economy?" https://www.deloitte.com/us/en/insights/industry/power-and-utilities/data-center-infrastructure-artificial-intelligence.html
[11] Data Center Frontier. (2024). "Data Center Nuclear Power Update: Microsoft, Constellation, AWS, Talen, Meta." https://www.datacenterfrontier.com/energy/article/55239739/data-center-nuclear-power-update-microsoft-constellation-aws-talen-meta
[12] Investing.com. (2025). "Nuclear Energy Stocks Surge 40% as Microsoft, Amazon Bet Billions on AI Power." https://www.investing.com/analysis/nuclear-energy-stocks-surge-40-as-microsoft-amazon-bet-billions-on-ai-power-200667915
[13] EuroNuclear. (2024). "Nuclear energy will power Google, Amazon, and Microsoft's server farms!" https://www.euronuclear.org/news/nuclear-energy-will-power-google-amazon-and-microsofts-server-farms-how-and-whats-the-story-behind-it/
[14] Marketplace. (2025). "As data centers gobble up electricity, Big Tech goes all-in on nuclear power." https://www.marketplace.org/story/2025/09/29/big-tech-goes-all-in-on-nuclear-as-data-centers-proliferate
[15] Wikipedia. (2025). "Dot-com bubble." https://en.wikipedia.org/wiki/Dot-com_bubble
[16] TED Ideas. (2024). "A revealing look at the dot-com bubble of 2000 — and how it shapes our lives today." https://ideas.ted.com/an-eye-opening-look-at-the-dot-com-bubble-of-2000-and-how-it-shapes-our-lives-today/
[17] Corporate Finance Institute. (2023). "Dotcom Bubble." https://corporatefinanceinstitute.com/resources/career-map/sell-side/capital-markets/dotcom-bubble/
[18] Wikipedia. (2025). "List of companies affected by the dot-com bubble." https://en.wikipedia.org/wiki/List_of_companies_affected_by_the_dot-com_bubble
[19] Britannica. "Dot-com Bubble & Bust." https://www.britannica.com/money/dot-com-bubble
[20] TheStreet. (2022). "What Was the Dot-Com Bubble & Why Did It Burst?" https://www.thestreet.com/dictionary/dot-com-bubble-and-burst
[21] YCharts. (2023). "Winners & Losers from the Dot Com Bubble Rate Hike Cycle." https://get.ycharts.com/resources/blog/winners-amp-losers-from-the-dot-com-bubble-rate-hike-cycle/
[22] Stanford. (2025). "Thirsty for power and water, AI-crunching data centers sprout across the West." https://andthewest.stanford.edu/2025/thirsty-for-power-and-water-ai-crunching-data-centers-sprout-across-the-west/
[23] Goldman Sachs. (2019). "The Late 1990s Dot-Com Bubble Implodes in 2000." https://www.goldmansachs.com/our-firm/history/moments/2000-dot-com-bubble
[24] CNBC. (2025). "Anthropic raises $13 billion funding round at $183 billion valuation." https://www.cnbc.com/2025/09/02/anthropic-raises-13-billion-at-18-billion-valuation.html
[25] CNBC. (2025). "Elon Musk's xAI raising $10 billion at $200 billion valuation: sources." https://www.cnbc.com/2025/09/19/musks-xai-10-billion-at-200-billion-valuation.html
[26] TechCrunch. (2025). "Perplexity reportedly raised $200M at $20B valuation." https://techcrunch.com/2025/09/10/perplexity-reportedly-raised-200m-at-20b-valuation/
[27] TechCrunch. (2025). "Scale AI confirms 'significant' investment from Meta, says CEO Alexandr Wang is leaving." https://techcrunch.com/2025/06/13/scale-ai-confirms-significant-investment-from-meta-says-ceo-alexandr-wang-is-leaving/
[28] CNBC. (2025). "Databricks says it's valued at over $100 billion in latest funding round." https://www.cnbc.com/2025/08/19/databricks-valuation-over-100-billion.html
DISCLAIMER
Educational Content Only - Not Financial Advice
This article provides educational information, analysis, and theoretical frameworks about AI market dynamics. It is NOT financial, investment, tax, or legal advice. No recommendations are made regarding any specific securities or investment strategies.
Key Limitations:
- Every investor's situation is unique and requires personalized professional analysis
- Past performance and historical patterns (including dot-com comparisons) do not predict future results
- AI and technology investments carry substantial risks including potential complete loss of capital
- Private investments carry extreme illiquidity risk, limited information, and high failure rates
- Market conditions, valuations, and company circumstances can change rapidly
- This analysis represents one perspective, not established fact or prediction
Investment Risks: The AI and technology sectors involve significant volatility and risk. Companies discussed may experience dramatic valuation changes, business failures, or other adverse outcomes. References to specific companies, valuations, and market dynamics are for illustrative purposes only and should not be construed as recommendations.
Required Professional Consultation: Before making any investment decisions, you must consult with qualified professionals including licensed financial advisors, CPAs, estate planning attorneys, and other appropriate specialists who can evaluate your complete financial situation, risk tolerance, time horizon, tax circumstances, and individual goals.
No Liability: The author, publisher, and distributors of this content:
- Make no guarantees or warranties about accuracy, completeness, or timeliness of information
- Are not responsible for any investment decisions or outcomes
- Have no knowledge of your personal circumstances
- Disclaim all liability for losses or damages resulting from use of this information
- Provide this content "as is" without any representations or warranties
Regulatory Compliance: Nothing in this article creates an advisory relationship. The author and publisher are not acting as your financial advisor and make no recommendations specific to any individual reader.
By reading this article, you acknowledge that it is for educational purposes only, does not constitute professional advice, and that you will consult with qualified professionals before making any investment or financial decisions.
Professional guidance tailored to your specific circumstances is essential before taking any action based on concepts discussed in this article.